

As of October 3, 2026, Bitcoin traded at $84,672.35 on the BTC-USD pair, down $2,131.05, or 2.46%, as of 12:00:46 PM UTC, according to Yahoo Finance, whose page attributes its data to Coinbase and CoinMarketCap. The print keeps the market below $85,000 and follows a two-month recovery that 24/7 Wall St. put at roughly 30% on September 30.
Key Takeaways
- ▼ BTC-USD printed $84,672.35, down 2.46%, as of October 3 at 12:00 UTC
- ▲ Dated commentary put the 60-day recovery at about 30% and the third quarter at a 44% gain
- ■ NVIDIA and TSMC closed higher on October 2 while Bitcoin fell — correlation, no evidenced mechanism
- ■ No verified 60-day daily OHLCV series existed in this run’s evidence set
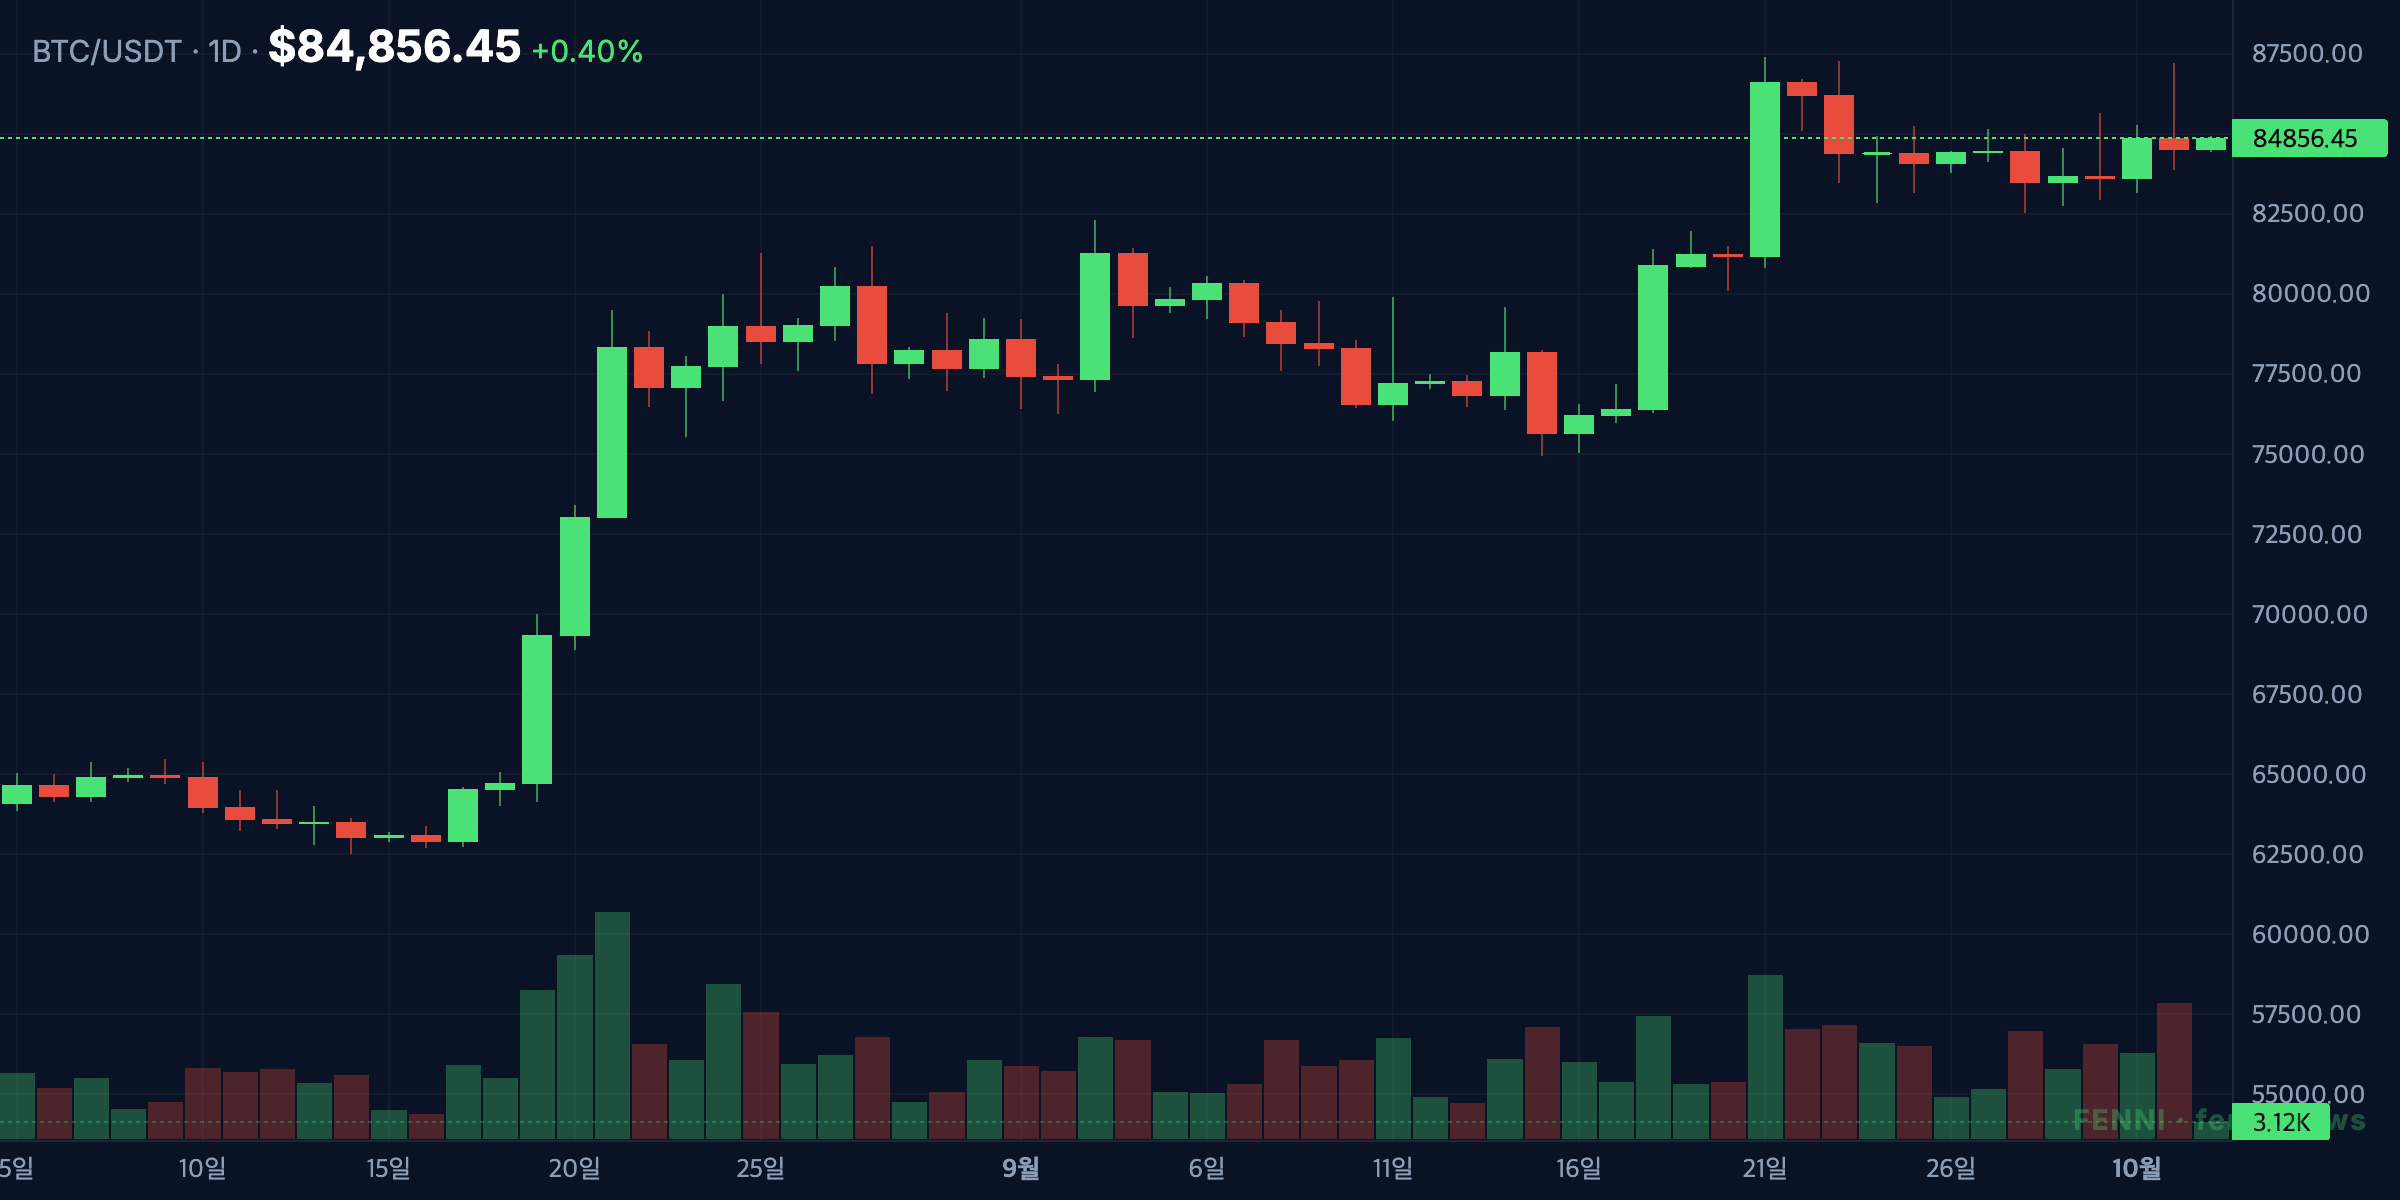


Where Bitcoin stands on October 3
The Yahoo Finance quote page shows a previous close and open of $84,506.34 and a day’s range of $84,434.45 to $84,713.72. The 52-week range spans $57,747.77 to $126,198.07, market capitalization stands at $1.701 trillion, and 24-hour volume is $32.47 billion. The chart-range block shows a 1-month gain of 4.17% and a 1-year loss of 30.76% — live-quote figures that drift with each capture.
What do the 60-day return figures actually cover?
The roughly 30% recovery figure comes from commentary, not from a data table. 24/7 Wall St., writing on September 30, said Bitcoin was “climbing about 30.0% in the last 60 days and 43.8% over the past 90 days” — author analysis with no dated daily price rows behind it. Separately, CoinGape reported on October 1 that “Bitcoin price added $25,800, gaining 44%” in the third quarter, attributed to a Bull Theory post on X.
Why did chip stocks and Bitcoin move in opposite directions?
While Bitcoin fell 2.46% on October 3, semiconductor equities closed the prior session higher: NVIDIA finished October 2 at $233.95, up 1.34%, and Taiwan Semiconductor closed at $472.78, up 2.96%, per Yahoo Finance. The evidence supports a correlation observation only — no mechanism linking the markets is established.
What the evidence does not include
This run’s evidence set contains no 60-day daily OHLCV series: fetches of the Binance source pages for the BTCUSDT and ETHUSDT trading pairs returned no content (HTTP 202), so no dated daily open, high, low, close, or volume rows could be verified from those pages. Every Bitcoin figure above is a BTC-USD proxy quote.
Risks and what to watch
24/7 Wall St.’s September 30 base-case range of $75,585 to $87,397 is that author’s analysis, not a data-derived level. ETF flows diverge by window: CoinGape, citing SoSoValue, recorded $2.65 billion of net September inflows into US spot Bitcoin ETFs, while 24/7 Wall St. noted daily inflows falling from nearly $1 billion on September 21 to $134 million by September 25. Both outlets point to the October 27–28 FOMC as the shared pivot event, with CME FedWatch odds of 64% for another quarter-point hike.
What was Bitcoin’s price as of October 3, 2026?
BTC-USD traded at $84,672.35, down 2.46%, as of 12:00:46 PM UTC, per Yahoo Finance. No BTCUSDT exchange-pair print was verified in this evidence set.
Is Bitcoin up over the last 60 days?
Per 24/7 Wall St.’s September 30 analysis, Bitcoin had climbed about 30.0% over 60 days and 43.8% over 90 days. Neither figure is a primary OHLCV calculation.
Why does this article use BTC-USD instead of BTCUSDT?
Binance source-page fetches returned no content during this run, so no verified daily OHLCV rows exist for the exchange pair; available quotes come from Yahoo Finance pages using Coinbase and CoinMarketCap data. BTC-USD prints are labeled as a proxy throughout.
Disclaimer: This article is for informational purposes only and does not constitute financial advice. Cryptocurrency investments carry significant risk. Always conduct your own research before making investment decisions.